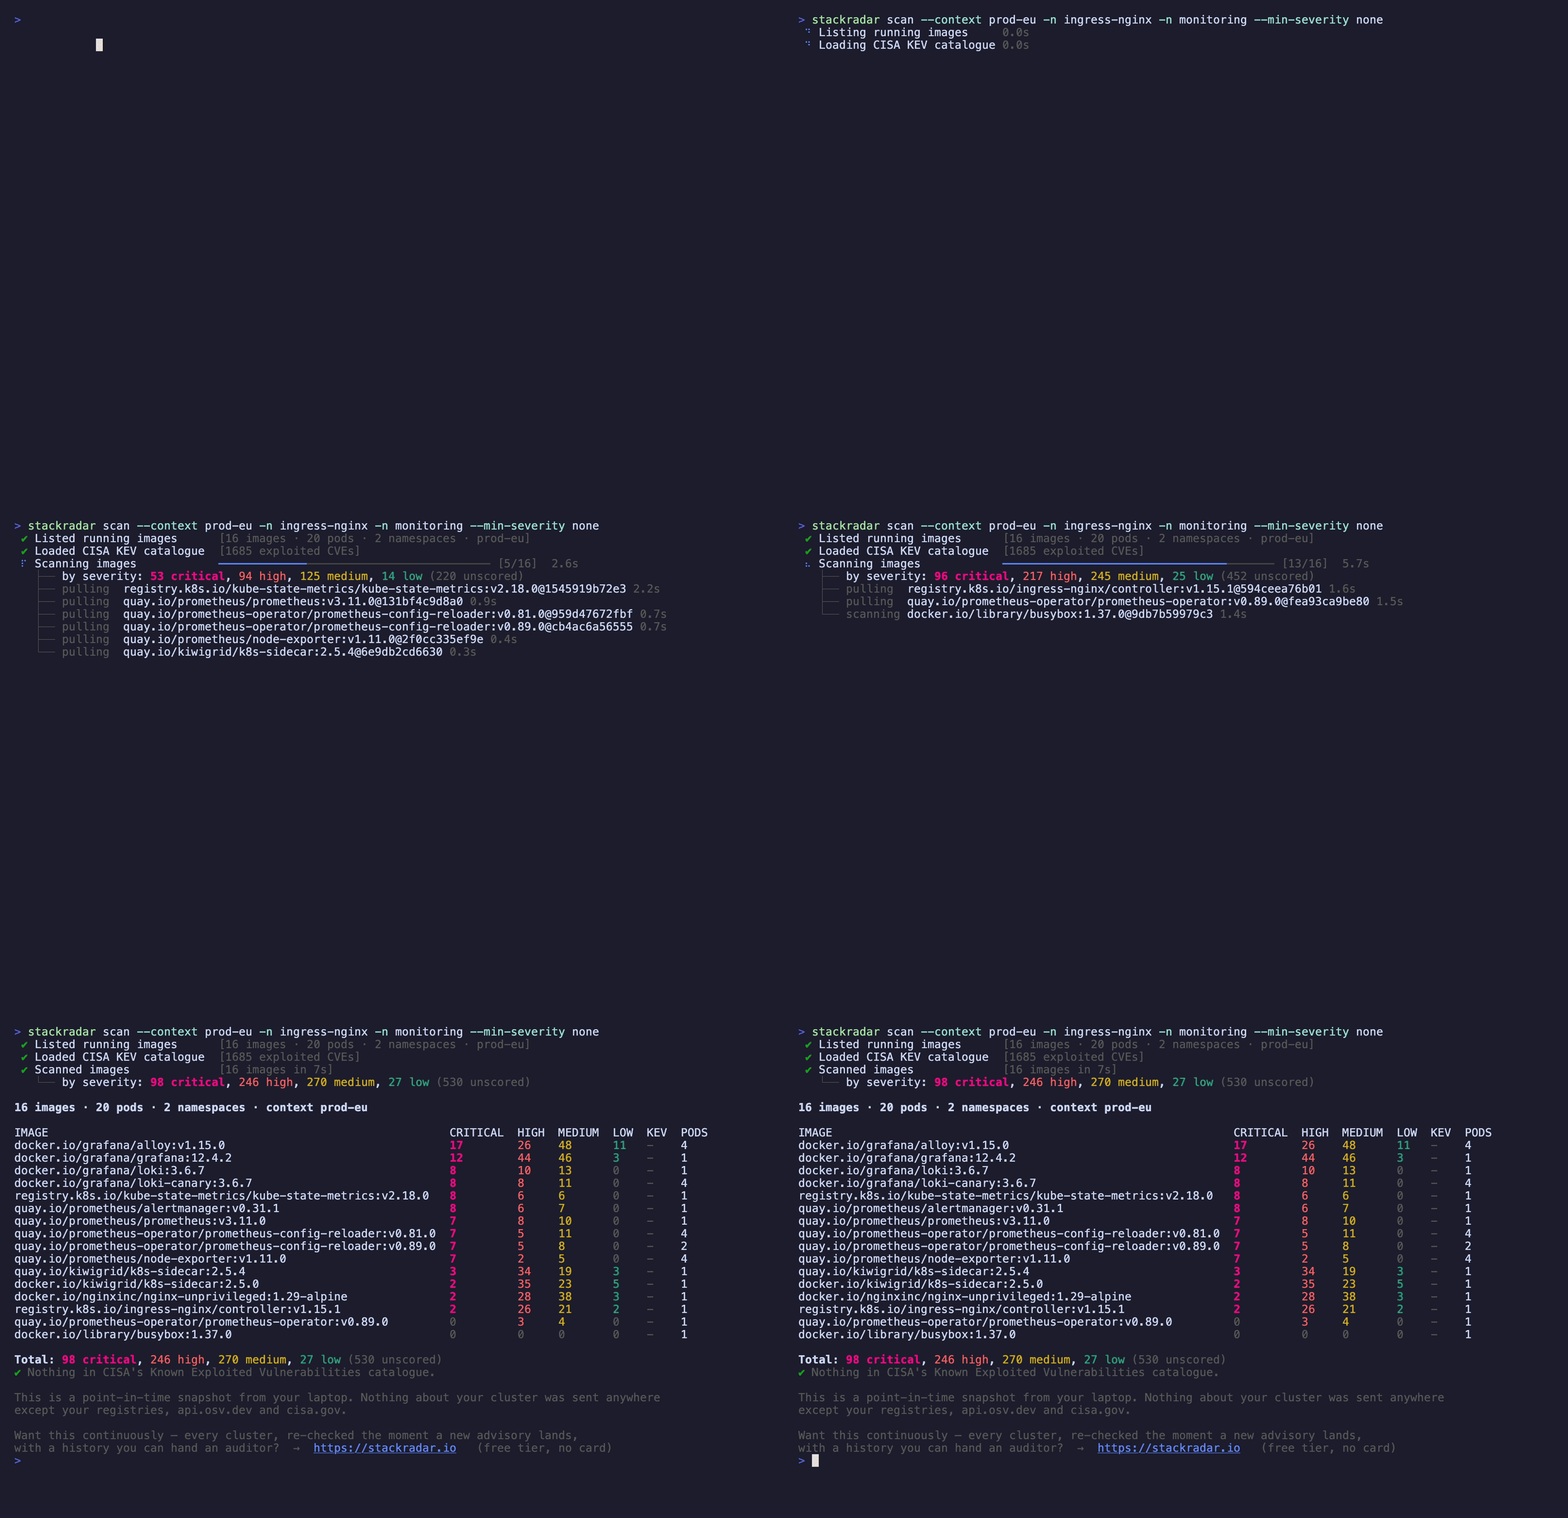
When a CVE lands and someone asks "are we affected?", stackradar scan answers it from what is actually running — the container digests the kubelet reports — not from what a manifest says. It walks every pod your kubeconfig can see, deduplicates the images, matches their OS and language packages against OSV, and flags anything in CISA's Known Exploited Vulnerabilities catalogue so the findings that are being exploited in the wild sort first. The launch post explains why enumeration starts from the kubelet rather than from your manifests.
Install
brew install lockdep/tap/stackradar
# or
curl -fsSL https://raw.githubusercontent.com/lockdep/stackradar-cli/main/install.sh | sh
# or
go install github.com/lockdep/stackradar-cli@latest
Binaries for Linux, macOS and Windows (amd64 and arm64) are on the releases page. It is a single static binary: no Docker daemon, no runtime dependencies.
One command, and what it gets you
# every running image; on a terminal it asks which kubeconfig
# context to use, in CI it takes the current one
stackradar scan

# specific context and namespaces
stackradar scan --context prod -n payments -n checkout

# one image, no cluster needed
stackradar scan --image nginx:1.27

# machine-readable, shareable, or live in the browser
stackradar scan -o json > report.json
stackradar scan -o html --file report.html
stackradar scan --serve- Scans what is running, not what is declared: enumeration starts from the digests the kubelet reports, so sidecars and admission-injected containers are included. It needs
list pods— the same permission askubectl get pods— and, if it can also list nodes, pulls each image for the architecture its node runs (otherwise it assumeslinux/amd64and says so). - Pulls with the credentials you already have —
~/.docker/config.json, credential helpers, cloud keychains — or, with--use-pull-secrets, the cluster's ownimagePullSecrets(the report then says which ones were used). - Ranks by exploitation, not just severity: CISA KEV entries are flagged on every surface, and
--fail-on kevgates CI on them alone. - Exit codes follow Grype's convention — 0 clean, 1 error, 2 threshold met — so it drops into existing CI logic unchanged.
A report you can hand to someone
--serve opens an interactive dashboard on 127.0.0.1; -o html writes the same thing as one self-contained file with no external assets, so it opens offline and can be attached to a ticket. Filter by image, package, CVE or pod; expand an image to see every finding with the fixed version next to it.
Nothing phones home, and you can check
--use-pull-secrets, and then credentials stay in memory for the pull and are never written to disk.Releases are built by GitHub Actions and the checksums are signed with cosign (keyless), so the binary you run is provably the source you can read:
cosign verify-blob checksums.txt --bundle checksums.txt.sigstore.json \
  --certificate-identity-regexp '^https://github.com/lockdep/stackradar-cli/' \
  --certificate-oidc-issuer https://token.actions.githubusercontent.com
sha256sum --ignore-missing -c checksums.txt
The CLI is a snapshot — StackRadar is the loop
A scan is true for the moment it ran; tomorrow's advisory can make today's clean image vulnerable without anything in the cluster changing. The CLI does not watch for that — the StackRadar scanner does: a small in-cluster agent that keeps a CycloneDX SBOM of every running image and re-checks it as advisories land, with every cluster in one dashboard, ranked by EPSS and KEV, history kept. Same team, same matching philosophy — the CLI is the answer today, the scanner is the answer that stays current. The container vulnerability scanner page covers when you want which.
Frequently asked questions
Is the StackRadar CLI open source?
Yes — the whole CLI is Apache-2.0, with every line on GitHub at github.com/lockdep/stackradar-cli. It embeds Google’s osv-scanner library for package extraction and matching, and its releases are built by GitHub Actions with cosign-signed checksums, so you can verify that the binary you downloaded is the code you can read.
Do I need to install anything in my cluster to use it?
No. The CLI is a single static binary that runs on your machine and talks to the cluster through your existing kubeconfig. It needs permission to list pods — the same access as `kubectl get pods`. If it can also list nodes, it pulls each image for the architecture its node runs; if it can’t, it assumes linux/amd64 and says so. `--use-pull-secrets` additionally needs `get` on secrets and serviceaccounts. There is no agent, no CRDs, no Helm chart, no Docker daemon. With `--image` it scans a single image and needs no cluster at all.
What data leaves my machine when I run stackradar scan?
Three things, all listed in the README: image pulls go to your own registries with your existing credentials, package names and versions go to api.osv.dev for advisory matching, and one GET fetches the CISA KEV catalogue from cisa.gov. Nothing is sent to stackradar.io — there is no account, no sign-up and no telemetry. The HTML report and the --serve dashboard are generated and served locally.
How is the StackRadar CLI different from Trivy or Grype?
Trivy and Grype scan an artefact you name; the StackRadar CLI starts from the container digests the kubelet reports as actually running, deduplicates them, scans each once, and attributes every finding back to the pods and namespaces that run it — including sidecars and images injected at admission that never appear in a manifest. It also flags CISA KEV entries so exploited CVEs sort first, and ships an interactive HTML report. For scanning a single named image in CI, all three are good choices.
How do I verify a downloaded release?
Every release’s checksums.txt is signed with cosign, keyless, from the repository’s GitHub Actions identity. Run `cosign verify-blob checksums.txt --bundle checksums.txt.sigstore.json --certificate-identity-regexp '^https://github.com/lockdep/stackradar-cli/' --certificate-oidc-issuer https://token.actions.githubusercontent.com`, then `sha256sum --ignore-missing -c checksums.txt` against your download.
Can I use it as a CI gate?
Yes. `stackradar scan --image $IMAGE --fail-on high` exits 2 when the threshold is met, 0 when clean and 1 on error — the same exit-code convention as Grype, so it drops into existing pipeline logic unchanged. `--fail-on kev` gates on known-exploited CVEs only, which is a far quieter signal than severity for teams starting out.